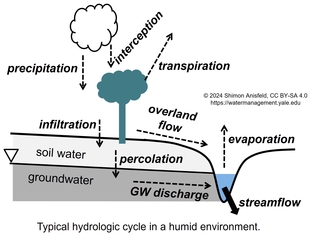
Water flows are movements of water between various stocks, expressed in units of volume per time; these flows make up the hydrologic cycle. This page explores the components of the local hydrologic cycle, using the figure below as a guide.
Water Flows
Precipitation: The amount of water vapor that an air mass can hold before that vapor condenses into liquid water (referred to as the saturation vapor pressure) is temperature-dependent, with warm air able to hold more water vapor than cold. The relative humidity describes how much water vapor is in the air, relative to the amount that the air can hold. When relative humidity reaches 100%—say, because the air has cooled and thus can hold less water—the air becomes saturated with water vapor, and the water vapor will start to condense and form clouds, ultimately leading to precipitation.
Broadly speaking, then, precipitation is driven by the cooling of air masses. Cooling, in turn, is generally driven by a vertically unstable atmosphere in which air rises and in the process cools down, which causes the relative humidity to increase until saturation is reached. A number of inter-related processes can cause air to rise, and thus tend to generate precipitation:
- Convection: Surface heating creates warm and thus buoyant air, which rises in thermals.
- Orographic effects: Air moving across a mountain range is forced upwards by the topography.
- Fronts: When air masses of different temperatures interact, the warmer, more buoyant air is forced upwards over the colder air.
- Convergence: Areas of low air pressure draw air towards them from all directions, forcing the converging air upwards. Convergence can also be caused by a surface with higher roughness than the surrounding landscape (e.g., a vertically-complex city in the middle of a flat prairie), where air is slowed down by the uneven surface; this slowing of air movement causes air to pile up (just like a driver slowing down can cause traffic to pile up), which, again, forces air upwards and thus drives cooling and precipitation.
Interception: When precipitation falls on a vegetated surface, some of the water will not reach the ground surface, but will instead land on trees and other vegetation. Of the precipitation that falls on vegetation, some will reach the soil by running down the trunk or dripping from the leaves, but some will accumulate on leaves and then evaporate without ever reaching the soil; this latter fraction is referred to as interception and can be subtracted from the gross precipitation above the canopy to determine net precipitation, defined as the amount of water that actually reaches the soil surface.
Infiltration and overland flow: When rain reaches the land surface, it can infiltrate into the soil. A soil’s maximum infiltration capacity is dependent on soil texture and other factors, with the lowest infiltration capacities being found in compacted, fine-textured (clay) soils with poor vegetative cover. When water can’t infiltrate into the soil—either because rain is falling faster than the maximum infiltration capacity or because the soil is already filled with water—the water will run off the surface as overland flow and make its way rather quickly to the nearest stream.
Percolation, transpiration, and evaporation: Once in the soil, water can move downwards in the soil profile and enter groundwater (percolation), but can also be pulled upwards by plants, which take up soil water with their roots and transport it to their leaves, where it is released back to the atmosphere as water vapor; this process is called transpiration and is essential for plant growth. Water can also move back to the atmosphere without the mediation of plants, through evaporation from the soil or from open water surfaces. In practice, evaporation and transpiration are hard to distinguish, and are collectively referred to as evapotranspiration or ET.
Conceptually, ET is determined by two factors: the evaporative demand of the atmosphere and the supply of water to meet that demand. The former is referred to as potential evapotranspiration (PET) and can be thought of as the amount of evaporation from an open water surface, such as a lake. PET (often expressed in mm/day) is a function of atmospheric conditions, with the highest PET occurring under hot, dry, sunny, and windy conditions. Actual ET may be less than PET when the supply of water is limited, as in dry soils. Reference evapotranspiration (ETo) is closely related to PET and is defined as the amount of ET from a well-watered reference plant, usually short grass (12 cm high). Like PET, ETo is a function of climatic conditions, and can range from about 1 to 10 mm/day. ETo, which is often used to understand crop water needs, can be calculated with the Penman-Monteith equation, using daily values of solar radiation, temperature, humidity, wind speed, and air pressure.
Unlike precipitation, ET is hard to measure directly, and is often estimated based on water budgets (below) or modeled based on PET and water availability. One technique for direct measurement of ET is eddy covariance, in which an instrument tower some height above the surface takes continuous readings of water vapor concentration and the direction of air flow. Since ET generates water vapor at the land surface, upward air flow contains higher concentrations of water vapor than downward air flow, and the covariance between the flow and the concentration can be used to calculate the upwards flux of moisture. (The same technique is used to measure fluxes of other gases, such as CO2.)
Groundwater discharge: Once water has entered groundwater, it will start to slowly flow downgradient, following the slope of the water table, and ultimately discharge into a stream. This stream—which has a water level that is lower than the water table and thus receives groundwater inflow—is referred to as a gaining stream. Over reasonably long time periods, the discharge of groundwater into the stream is likely to be balanced by the recharge of groundwater through percolation, so the water table will not move up or down much over time (though there are often seasonal fluctuations of the water table, and drought or human over-use can certainly lead to falling water tables). Groundwater can also discharge to the surface at sites other than rivers, such as wetlands, springs, lakes, or the ocean.
In arid environments, the interaction of groundwater and surface water is likely to be different from that shown in the figure above. In particular, the water table is likely to be below the level of the streambed, so surface water will flow into the ground and recharge groundwater, making the stream a losing stream. (Pumping of groundwater can lower the water table and convert gaining streams into losing streams.) In these arid environments, when groundwater does reach the surface, it may discharge to an isolated oasis or playa, rather than a river.
Streamflow: We use the term “stream” to refer to flowing water of any size, with “river” usually reserved for larger streams. Perennial streams are those that carry water year round, intermittent streams only flow during the wet season, and ephemeral streams only flow for a short time after rain events. In arid settings, ephemeral stream valleys that are dry most of the time, but occasionally carry large loads of water and sediment, are often referred to as arroyos or wadis. When they are flowing, arroyos may discharge either to a perennial river or to a playa: a depression with no external drainage, where the water sits and evaporates rather than flowing downstream.
Streamflow is the volume of water that a stream carries past a given location per unit time (typical units: m3/sec or ft3/sec, with the latter also known as cfs for Cubic Feet per Second)). Streamflow is also referred to as discharge or runoff, although the term “runoff” has a variety of meanings. A graph of flow over time is referred to as a hydrograph. The US Geological Survey (USGS) provides real-time hydrographs, with 15-minute resolution, at thousands of river gauging stations in the US. This is done using dataloggers that measure river stage (water level relative to some datum), which is then converted to flow using a rating curve: the statistical relationship between water depth and flow, which is obtained from periodic measurements of both depth and flow under different conditions.